What is Panel Data? A Comprehensive Guide for Researchers and Analysts
In the realm of statistical analysis and econometrics, panel data stands out as a powerful tool for understanding complex relationships over time. But what is panel data, exactly? Simply put, panel data, also known as longitudinal data or cross-sectional time series data, combines the dimensions of both time series and cross-sectional data. This means that you observe multiple subjects (individuals, firms, countries, etc.) over multiple time periods. Understanding what is panel data and how to use it effectively is crucial for researchers and analysts seeking deeper insights into dynamic processes.
This article aims to provide a comprehensive guide to panel data, covering its definition, advantages, disadvantages, different types, common models, and practical applications. By the end, you’ll have a solid understanding of what is panel data and how it can be applied to address a wide range of research questions.
Understanding the Basics of Panel Data
Definition and Structure
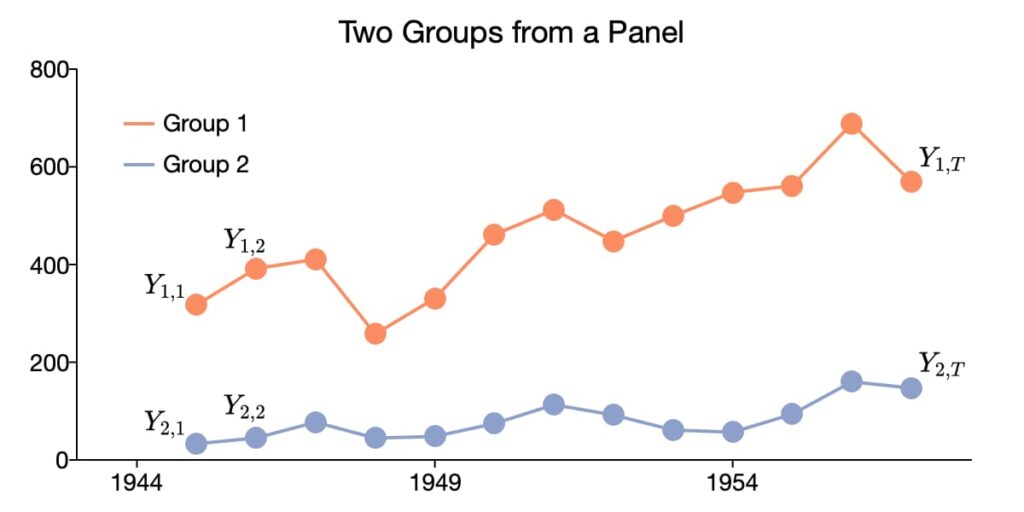
To truly grasp what is panel data, it’s essential to understand its structure. Imagine a spreadsheet. In a typical cross-sectional dataset, each row represents a different subject (e.g., individual), and each column represents a different variable (e.g., income, education). In a time series dataset, each row represents a different time period (e.g., year), and each column represents a different variable (e.g., GDP, inflation). Panel data combines these two structures. Each row represents an observation for a specific subject at a specific point in time. Therefore, you have data on multiple subjects, each observed at multiple points in time.
For example, consider a panel dataset tracking the income of 100 individuals over 10 years. Each individual would have 10 observations, one for each year. The dataset would contain 1000 observations in total.
Key Components
- Individuals (or Entities): These are the subjects being observed. They can be people, companies, countries, or any other unit of analysis.
- Time Periods: These are the points in time at which the individuals are observed. They can be years, quarters, months, or any other time interval.
- Variables: These are the characteristics being measured for each individual at each point in time. Examples include income, education, investment, or GDP.
Advantages of Using Panel Data
Using panel data offers several advantages over using cross-sectional or time series data alone. These advantages stem from the ability to control for individual heterogeneity and to examine dynamic relationships.
Controlling for Individual Heterogeneity
One of the most significant advantages of panel data is its ability to control for individual heterogeneity. This means that you can account for unobserved differences between individuals that remain constant over time. For example, in a study of wages, panel data can help control for factors like innate ability or family background, which are difficult to measure directly but may influence an individual’s earnings. By controlling for these unobserved factors, panel data can provide more accurate estimates of the effects of other variables.
Greater Efficiency
Panel data typically provides more informative data, more variability, less collinearity among the variables, more degrees of freedom, and more efficiency than cross-sectional or time-series data. Because panel data contains more observations, it can lead to more precise estimates of the parameters of interest.
Studying Dynamic Relationships
Panel data allows researchers to study how variables change over time for each individual. This is particularly useful for understanding dynamic processes, such as the effects of policy changes or economic shocks. For instance, you can use panel data to examine how a change in tax rates affects individual investment decisions over time. [See also: Understanding Longitudinal Data Analysis]
Identifying and Measuring Effects Not Detectable in Cross-Sectional or Time Series Data
Certain effects can only be identified using panel data. For example, consider the impact of a new training program on employee productivity. A cross-sectional study might compare the productivity of employees who participated in the program to those who didn’t, but it wouldn’t account for pre-existing differences between the two groups. A time series study might track the overall productivity of the company before and after the program, but it wouldn’t isolate the effect of the program from other factors that may have influenced productivity. Panel data, on the other hand, can track the productivity of each employee over time, allowing you to control for individual characteristics and isolate the effect of the training program.
More Accurate Inference of Model Parameters
By combining cross-sectional and time-series data, panel data provides a richer source of information, leading to more accurate inferences about the relationships between variables.
Disadvantages of Using Panel Data
Despite its many advantages, panel data also has some drawbacks. These include data collection challenges, computational complexity, and potential biases.
Data Collection Challenges
Collecting panel data can be time-consuming and expensive. It requires tracking the same individuals over multiple time periods, which can be difficult, especially if individuals move or drop out of the study. Maintaining data quality and ensuring consistent measurement across time periods can also be challenging.
Computational Complexity
Analyzing panel data can be computationally intensive, especially with large datasets or complex models. Specialized statistical software and expertise are often required to handle the complexities of panel data analysis.
Potential Biases
Panel data is susceptible to certain types of biases. Attrition bias occurs when individuals drop out of the study, and their absence can affect the results if their characteristics differ systematically from those who remain. Selection bias can occur if the initial sample is not representative of the population of interest. Endogeneity, where the explanatory variables are correlated with the error term, is also a common concern.
Spurious Correlation
As with any longitudinal data, there’s a risk of finding spurious correlations if not analyzed correctly. Changes over time might appear related, but this could be due to other factors not included in the model.
Types of Panel Data
Panel data can be classified into different types based on its structure and characteristics.
Balanced vs. Unbalanced Panel Data
- Balanced Panel Data: In a balanced panel, each individual is observed for the same number of time periods. This is the ideal scenario for many statistical models.
- Unbalanced Panel Data: In an unbalanced panel, individuals are observed for different numbers of time periods. This can occur due to attrition, entry into the study at different times, or other reasons. While unbalanced panels are more common in practice, they require more careful handling in the analysis.
Short vs. Long Panel Data
- Short Panel Data: Short panels have a small number of time periods relative to the number of individuals. These panels are often used when the focus is on cross-sectional variation.
- Long Panel Data: Long panels have a large number of time periods relative to the number of individuals. These panels are better suited for studying dynamic relationships and long-term trends.
Common Panel Data Models
Several statistical models are commonly used to analyze panel data. These models account for the specific structure of panel data and address the challenges of individual heterogeneity and time dependence.
Fixed Effects Model
The fixed effects model assumes that the unobserved individual characteristics are correlated with the explanatory variables. It controls for these unobserved characteristics by including individual-specific intercepts in the regression equation. The fixed effects model is particularly useful when you believe that the unobserved characteristics are likely to be related to the variables you are studying. The key strength is its ability to eliminate bias from time-invariant confounders.
Random Effects Model
The random effects model assumes that the unobserved individual characteristics are uncorrelated with the explanatory variables. It treats these unobserved characteristics as random variables and includes them in the error term. The random effects model is more efficient than the fixed effects model when the assumption of no correlation is valid. However, if the assumption is violated, the random effects model can produce biased estimates. [See also: Fixed Effects vs Random Effects]
First Difference Model
The first difference model transforms the data by taking the difference between consecutive time periods for each individual. This eliminates any time-invariant individual effects and can be useful when the unobserved characteristics are correlated with the explanatory variables. The first difference model is a special case of the fixed effects model.
Dynamic Panel Data Models
Dynamic panel data models include lagged values of the dependent variable as explanatory variables. These models are used to study dynamic relationships and account for the persistence of effects over time. Examples include the Arellano-Bond estimator and the system GMM estimator.
Applications of Panel Data
Panel data is used in a wide range of fields, including economics, finance, sociology, and political science. Its ability to control for individual heterogeneity and examine dynamic relationships makes it a valuable tool for addressing a variety of research questions.
Economics
In economics, panel data is used to study topics such as the determinants of economic growth, the effects of fiscal policy, and the impact of trade liberalization. For example, researchers have used panel data to examine how changes in tax rates affect investment decisions, or how trade agreements affect firm productivity.
Finance
In finance, panel data is used to study topics such as corporate governance, asset pricing, and financial performance. For example, researchers have used panel data to examine the relationship between board composition and firm value, or to assess the performance of mutual funds.
Sociology
In sociology, panel data is used to study topics such as social mobility, family dynamics, and the effects of education. For example, researchers have used panel data to examine how individuals’ social status changes over time, or how family structure affects children’s educational outcomes.
Political Science
In political science, panel data is used to study topics such as political behavior, public policy, and international relations. For example, researchers have used panel data to examine how voter turnout changes over time, or how foreign aid affects economic development.
Conclusion
Panel data is a powerful tool for researchers and analysts seeking to understand complex relationships over time. By combining the dimensions of both time series and cross-sectional data, panel data offers several advantages over using either type of data alone. While there are challenges associated with collecting and analyzing panel data, the benefits often outweigh the costs. With a solid understanding of the basics, types, models, and applications of panel data, you can leverage this valuable tool to gain deeper insights into the dynamic processes shaping our world. Understanding what is panel data is just the beginning; mastering its application is where the real power lies.
